Covid-19 Research
Combating Covid-19 with Data Science
Many research groups across campus have been aligning their research expertise in data science to provide new insights in understanding the spread of the pandemic and building tools to help aid decision-making in mitigating the impact of the disease.
 Jim Dai (Professor, ORIE) is leading a modeling effort to forecast short-term ventilator needs with Cornell PhD students Mark Gluzman (Applied Math), Alyf Janmohamed (Operations Research) and Yaosheng Xu (Statistics). They have developed an algorithm to predict the number of Covid-19 patients who will start to use ventilators tomorrow. This algorithm is intended to be used by a large hospital, or a group of coordinated hospitals, at the end of each day (e.g., 8pm) when the current number of non-ventilated Covid-19 patients and the predicated number of Covid-19 admissions for tomorrow are available; this can be used when coordinating local needs with a central stockpile that can augment on-hand supplies overnight. The predicted number of new admissions can be replaced by the numbers of Covid-19 admissions in the previous d days (including today) for some positive integer d when such data is available. A webtool providing an interface with this algorithm can be found at https://covidvent.github.io.
How many patients will need ventilators tomorrow? and Full Paper version (pdf)
 Peter Frazier (Associate Professor, ORIE) is leading a mathematical modeling effort advising Provost Kotlikoff on the likely impact of various interventions to help Cornell with re-opening plans; many of the details of this analysis are contained in this whitepaper (pdf). Students include Massey Cashore, Alyf Janmohamed, Jiayue Wan and Ning Duan of ORIE, and Yujia Zhang of CAM. ORIE faculty members Shane Henderson and David Shmoys are playing supporting roles. The centerpiece of this work is a stochastic population-level simulation that models the number of people in each of a number of states over time. States describe the course of the disease over time in an individual in a detailed way that builds on a standard SEIR epidemic model; the new model adds a more detailed accounting of when an individual becomes PCR positive, includes asymptomatic but infectious individuals, and models how an individual’s age influences the severity of their symptoms.
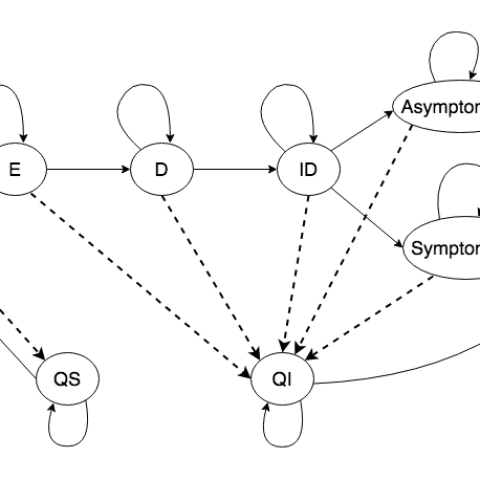
The dynamics between disease and quarantine states over a single time period for the stochastic population-level simulation. “S” = susceptible, “E” = exposed, “D” = detectable, “ID” = infectious and detectable, “Asymptomatic” = in severity group 1, “Symptomatic” = in severity group 2, “R” = recovered, “QS” = quarantined susceptible, and “QI” = quarantined infected. Solid lines represent the epidemiological progressions as well as people being released at the end of their quarantine; dashed lines represent the effects of intervention measures, including testing, self-reporting, and contact-tracing, which put some of the population into isolation/quarantine.
Another element of the work being done by Frazier’s research team is a framework for carrying out group testing for the SARS-CoV-2 virus – group testing is an idea dating to WWII in testing for STDs in which limited test supplies can be used to greater effect by combining the samples of many individuals at once – if the virus isn’t present in the combined sample, then (in principle) none of the individuals in the group is infected. Group testing could screen entire US, research suggests | Cornell Chronicle
A 5×5 square array group test. 25 samples are placed into a 5×5 array, divided into five row groups and five column groups. A test is run on each group, totaling 10 tests. Samples at the intersection of positive groups (red) receive individual follow-up tests.

Working to support Nathaniel Hupert Weill Cornell doctor creates epidemic modeling tool | Cornell Chronicle, David Shmoys (ORIE) and undergraduates Wes Gurnee and Lily Liu developed a stochastic model for attributing hospital-based data on COVID-19 positive admissions to a zip-code attribution (which had not been accessible in hospital-aggregated data); the model relies on a separate feed of zip-code level syndromic data as reported by private practices, and relying on a change-point analysis, the linkage between the two models is determined.
[/et_pb_text][et_pb_image src=”https://datasciencecenter.cornell.edu/files/2023/01/hospitalizations_estimates_by_zip_by_day.gif” admin_label=”Hospitalizations Estimates” _builder_version=”4.0.11″][/et_pb_image][/et_pb_column][/et_pb_row][et_pb_row _builder_version=”4.0.11″][et_pb_column type=”4_4″ _builder_version=”4.0.11″][et_pb_text admin_label=”Dave Goldberg, Sane Henderson” _builder_version=”4.0.11″ background_size=”initial” background_position=”top_left” background_repeat=”repeat”]


Dave Goldberg, Shane Henderson (ORIE) and OR PhD student Andrew Daw have developed a model to determine how to share ventilators across multiple locations to minimize deaths. Ventilators have been in short supply in a state, region or country, and so sharing has been essential in minimizing the death toll. Although this was done in a relatively ad hoc way for the peak demands recently crested, modeling and analytics can play a critical role in coordinating these limited resources. One can move ventilators to those areas where they are most needed, assuming the epidemic peaks at different times at different locations. This model can help trade off those nightmarish scenarios where a ventilator is needed locally, but can save more lives somewhere else because patients elsewhere have lower mortality rates owing to their age profile or co-morbidities. The model explicitly models the uncertainties in how the epidemic will evolve. A whitepaper.pdf describes this modeling tool and demonstrates its use in a case study for New York state at the time when it was predicted that the state would undergo a severe shortage of ventilators. Should you wish to use the tool please contact me for assistance
This plot shows the modeled number of deaths per day in NYC over the course of an epidemic for a hypothetical scenario in which NY state faces a shortage of ventilators, where ventilators are allocated to minimize deaths. Patients are divided into groups by age. The eldest group suffer many deaths around Day 50 owing to a need for ventilators in the upstate region (not shown), where those ventilators are allocated to patients more likely to survive.
In other work, Shane Henderson, with colleagues Marjin Jansen, Sarat Moka and Yoni Nazarathy of the University of Queensland, Australia; James McCaw, Aapeli Vuorinen and Peter G. Taylor of the University of Melbourne; and Chris Rackauckas and Raj Dandekar of the Massachusetts Institute of Technology, has developed a system, which they call Safe Blues, that is, in effect, a digital “virus” that could piggyback on contact-tracing apps and spread from smartphone to smartphone in real time. This would allow policymakers to gauge the impact of various social distancing measures without waiting two weeks or longer to learn how coronavirus has actually spread.
Illustration of Safe Blues on a simulated epidemic. The blue lines represent Safe Blues strands, the red markers are the true numbers of infectives, and the blue line represent a Safe Blues prediction of the state of the epidemic. The simulation assumes that real case numbers are delayed by 15 days, which reflects the reality of COVID-19: a long incubation period and mild symptoms at the start of infection mean that diagnoses are significantly delayed, while Safe Blues data is received in real time. In this way, the Safe Blues framework may provide unique, invaluable visibility into the current state of the epidemic and a powerful tool for early detection of subsequent waves or outbreaks.

Huseyin Topaloglu (Professor, ORIE) is working with OR PhD student Mika Sumida, Columbia PhD student (and incoming Cornell Tech faculty member) Omar El-Housni and colleagues Paat Rusmevichientong (a former Cornell ORIE faculty member) and Serhan Ziya to study how much testing is needed in NYC to safely ease social distancing measures there. Their findings have important implications on the magnitude of the testing capacity the City needs as it relaxes the social distancing measures to reopen its economy. They use a compartmentalized model to study the effects of testing capacity and social distancing measures on the evolution of the pandemic in the post-Pause period in the City. Their research shows that testing capacity must increase dramatically if it is to counterbalance even relatively small relaxations in social distancing measures in the immediate post-Pause period. In particular, if the City performs 20,000 tests per day and relaxes the social distancing measures to the pre-Pause norms, then the total number of deaths by the end of September can reach 250,000. Returning to the pre-Pause social distancing norms quickly must be accompanied by an exorbitant testing capacity, if one is to suppress excessive deaths. If the City is to go back to the pre-Pause social distancing norms in the immediate post-Pause period and keep the total number of deaths by the end of September at around 35,000, then it should be performing 500,000 tests per day.
Trajectory of the daily deaths under testing capacities of 20,000 per day. IMAGE NEEDED
Trajectory of the daily deaths under testing capacities of 100,00 per day. IMAGE NEEDED

Samitha Samaranayake (Assistant Professor, Civil and Environmental Engineering) has been working with colleagues Benedetto Piccoli (Rutgers-Camden) and Dan Work (Vanderbuilt) to model the impact of local travel patterns on the spread of COVID-19. While impacts of travel are indirectly accounted for within the parameters that describe the overall disease transmission rate within typical approaches, commonly used (single-region) models do not explicitly capture mobility at a local scale when considering the disease dynamics. As a consequence, mobility-restricting policies can only be coarsely understood by changing parameters that control the overall transmission rate. Meta-population (or multi-group) SEIR models provide a framework for explicitly modeling the spatial dynamics of the disease spread. This project aims to build a general tool for modeling complex human mobility patterns at local scale and simulate the corresponding disease dynamics.
A Multi-Region SEIR Model with Mobility
Simulation Tool